What is a Pourbaix diagram
This section will explain the Pourbaix diagram and the parameters that influence the speciation of chemical elements in a solution such as
- pH
- Redox
Ions in water can have different oxidation numbers depending on the potential of the water. Each different ion will dissociate into different species depending on pH. Arsenic for example, is a heavy metal that has several oxidation states (-3, 0, +3, +5) but is mostly present in natural water as arsenate (As⁵⁺) and arsenite (As³⁺). The dissociation of each Arsenate (As⁵⁺) and arsenite (As³⁺) are pH depended.
Arsenate (As⁵⁺) dissociates sequentially in water according to the following formula:
H₃AsO₄ ↔ H₂AsO₄¯ + H⁺ ↔ HAsO₄²¯ + 2H⁺ ↔ AsO₄³¯ + 3H⁺ (1)
Arsenite (As³⁺) dissociates according to the following formula:
H₃AsO₃ ↔ H₂AsO₃¯ + H⁺↔ HAsO₃¯ + 2H⁺↔ AsO₃³¯ + 3H⁺ (2)
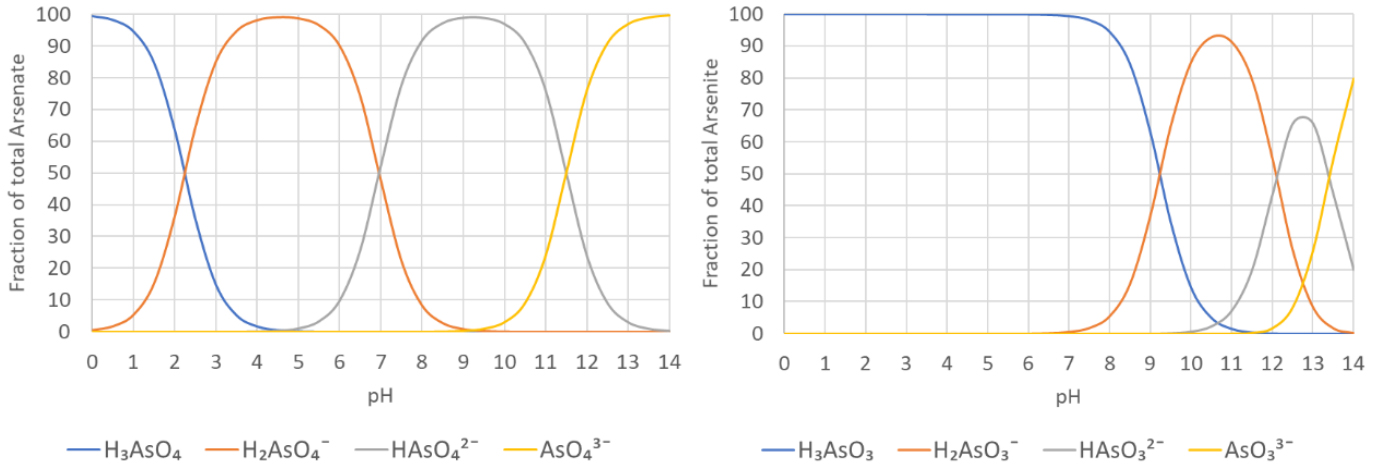
Figure 1: Arsenate (As⁵⁺) dissociation as function of the pH
Figure 2: Arsenite (As³⁺) dissociation as function of the pH
Figure 1 indicates that arsenate (As⁵⁺) dissociates sequentially in water according to equation 1. At pH 7, almost equal concentrations of H₂AsO₄¯ and HAsO₄²¯ will be present. The net molecular charge of arsenate is negative (-1 or -2) at pH levels between 5 and 7, enabling it to be removed with greater efficiency.
Figure 2 shows that arsenite (As³⁺) dissociates in water, too. At a pH of 7, H₃AsO₃ is the dominant species while H₂AsO₃¯ represents a small fraction (1.0%) and the contribution of HAsO₃²¯ and AsO₃³¯ is insignificant. Since the net charge of arsenite is neutral at natural pH levels (6-9), this form is not easily removed. Conversion to arsenate is a critical element of any arsenic treatment process.
Figure 1 show that H₂AsO₄¯ is the dominant species of arsenate at pH =3. Figure 2 shows that H₃AsO₃ is the dominant species of arsenate at pH =3. The concentration ratio of arsenate (As⁵⁺)/ arsenite (As³⁺) for different redox potentials at pH 3 can be calculated by the Nernst equation. When these concentration ratios of arsenate (As⁵⁺)/ arsenite (As³⁺) are calculated for the complete pH range and we plot thermodynamic equilibrium concentration as a function of the pH and redox-potential then we show the predominance areas of the different species of arsine species as shown in Figure 3. This graph is called the potential – pH diagram or after the inventor, the chemist Marcel Pourbaix (1904–1998).
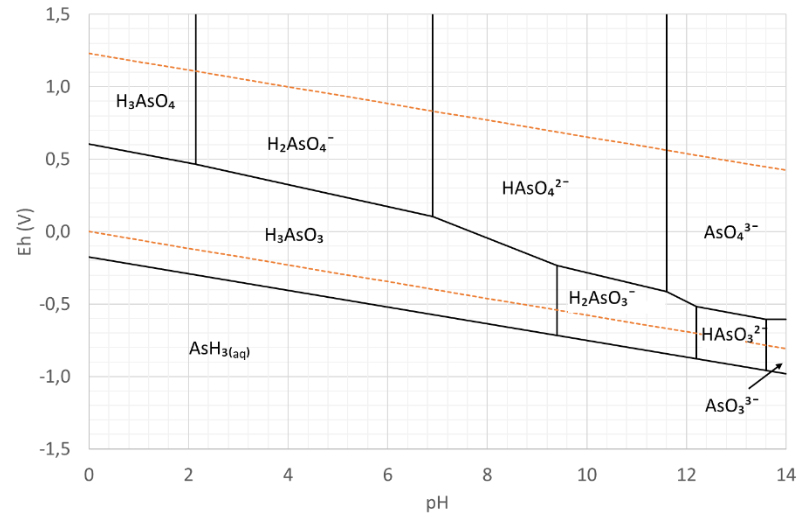
Figure 3: The Pourbaix diagram of arsenic
In electrochemistry, a Pourbaix diagram, also known as potential/pH diagram, depicts possible equilibrium phases of an aqueous electrochemical system. The lines in the Pourbaix diagram describe the state of equilibrium for the different species on either side of the line. In the areas between the lines, the species shown is predominant. Besides potential and pH value, the equilibrium concentrations are also dependent on factors such as temperature, pressure and concentration. Pourbaix diagrams are usually given at room temperature, atmospheric pressure and molar concentrations of 10¯⁶. Changing one of these parameters results in a different diagram.
Pourbaix diagrams are used, for example, in corrosion studies, the geosciences and in environmental assessments. The correct use of the Pourbaix diagram not only helps to illustrate the nature of the species present in the solution (or sample) but can also contribute to the understanding of reaction mechanisms.
The Pourbaix diagram of water
1) Impact of the pH water
The pH water is an indication of the amount of hydrogen (H⁺) ions defined as follows
pH = – log (H⁺) (H⁺ is expressed in moles per litre)
The pOH water is an indication of the amount of hydroxyl (OH¯) ions defined as follows
pOH = – log (OH¯) (OH¯ is expressed in moles per litre)
Water dissociates to hydrogen(H⁺) and hydroxyl (OH¯) according to following reaction equation
H⁺ + OH¯↔ H₂O
With a dissociation equation
Kₑ = [H⁺]. [OH¯] (1)
Where:Kₑ = water dissociation constant (10¯1⁴)
[H⁺] = Hydrogen ion concertation in water (expressed in moles per litre)
[OH¯] = Hydroxyl concentration in water (expressed in moles per litre)
If one takes the negative logarithm of equation (1) we obtain:
-log (Kₑ) =log [H⁺] + log [OH¯]
-log (10¯¹⁴) =log [H⁺] + log [OH¯]
14 = pH + pOH
At pH 7 we have
14 = 7 + pOH
pOH = 7
pH
If the pH range is adjusted from 0 to 14 than we obtain following
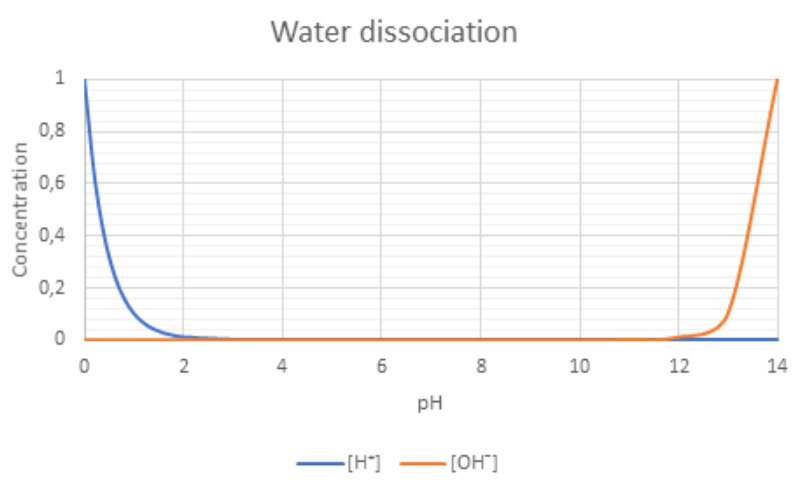
Figure 4: Water dissociation on different pH
Conclusion:
- At low pH we have more hydrogen (H⁺) ions
- At neutral pH the concertation of hydrogen(H⁺) and hydroxyl (OH¯) ions is equal
- At high pH we have more hydrogen Ions hydroxyl ions
2) Impact of the redox potential
Oxygen and hydrogen have following redox potentials:
| Element | Redox | Stable compound |
|
Oxygen |
0 |
O₂ |
|
|
-2 |
OH¯ |
|
Hydrogen |
+1 |
H⁺ |
|
|
0 |
H₂ |
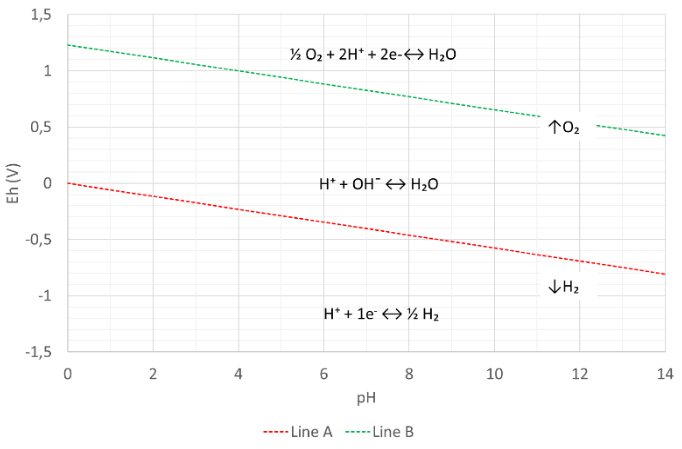
Figure 5: The Pourbaix diagram of water
Figure 5 shows the Pourbaix diagram of water. The diagram has two lines of equal concentration.
For the green line B we consider following two reactions:
Above line B: ½ O₂ + 2H⁺ + 2e-↔ H₂O Redox state of the oxygen atom O = 0
Below line B: H⁺ + OH¯ ↔ H₂O Redox state of the oxygen atom O = -2
For the red line A we consider following two reactions:
Above line A: H⁺ + OH¯ ↔ H₂O Redox state hydrogen atom (H) = +1
Below line A: H⁺ + 1e- ↔ ½ H₂ Redox state hydrogen atom (H) = 0
With the help of the Nernst equation it is possible to calculate:
Above line B: [½O₂] > [OH¯]
On straight line B: [½O₂] = [ OH¯]
Below line B: [½O₂] < [OH¯]
Above line A: [½H] < [H⁺]
On straight line A: [½H] = [H⁺]
Below line A: [½H] > [H⁺]
Natural water is found typically in a pH range between 4 - 9 and a redox potential range between 0 and 0.5V.
The Pourbaix or potential/pH diagrams of different heavy metals in water are used to select the optimum operating conditions and best removal medium for :
- Arsenic ions
- Chromium ions
- Lead species
- Mercury species
- Nickel ions


3 Comments